Clif's Astronomy Site
Double Star Observation
April 6,2020. In very poor seeing (2/10) I took 1000 speckle images of the Trapezium and another 1000 images of the nearby star theta Orionis (SAO 132321) to use as a reference. After processing into FITS cubes and Bispectrum processing, the Bispectrum Phase Reconstructed image is shown below. Rather remarkable resolution considering the really bad seeing.

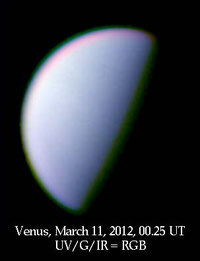
April 1, 2020. I attempted to get speckle images from nearby 9th magnitude singlet TYC 775 411 but discovered that the light from the half moon was shining right into the lens of my video finder making it impossible to see either HJ 3291AB or the nearby reference star. Seeing was quite poor as well. I pointed the telescope to Venus and saw a beautiful sight in the video finder: The Pleiades star cluster was filling the Northeast quadrant of the screen and an overexposed Venus shining like a supernova in the center of the screen. I looked at Venus with the C14/2xBarlow/ASI224MC combination and decided seeing was too poor to even attempt imaging. Looks like I need a good sunshade for my finder lens to avoid this problem in the future.
March 27, 2020. Replacing the ASI290MM with the ASI224MC to see if the interference was camera related was my next goal. The 224 was mounted on the C14 along with a 2x Barlow to get a focal ratio better suited to sampling the speckles. Three sets of 2000 FITS were taken of WDS 007239+1408 HJ 3291AB and the images processed with the tools in the Speckle Toolbox. Results were MUCH better. No interference.

PSD Autocorellogram Measures
Theta rho
1 117 746 4.9549
2 117.749 4.9604
3 117.745 4.9632
These values are quite consistent with the last measure done in 1997
Next I tried Bispectrum processing to see if an image with the phase ambiguity removed could be recovered from the data. The result is shown below.

Next job is to get FITS images of a suitable nearby calibration star to see if the results can be improved. The nearby 9th magnitude star TYC 775 411 is probably a singlet and is close to HJ 3291AB in brightness. Will try that.
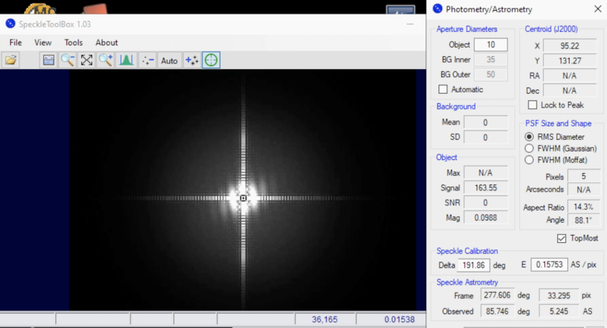
March 26, 2020. The ASI290MM camera was attached to the C14 on the AP mount and twp sets of 2000 FITS images were taken of the star WDS 007239+1408 HJ 3291AB. The last measure of this star was in 1997 when the position angle was 117° and the separation was 5 arc seconds. When the images were processed with the Speckle Toolbox (written by David Rowe) the results were a mess. Some kind of interference made the autocorrelogram nearly useless. Fringes were vidsible in the PSD however:
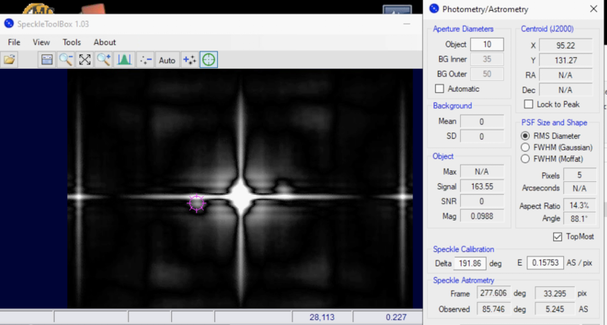
The distance from the small blob (with pink target on it) from the center was 5.2 arc seconds, close to the last measured value.
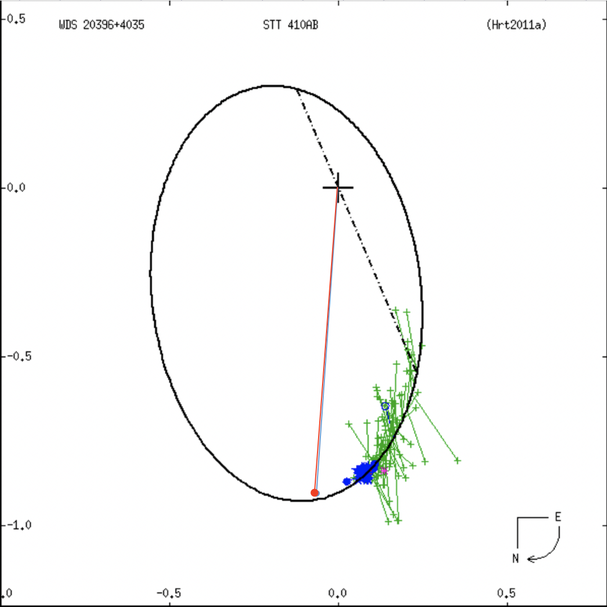
November 3, 2016. It is nice to compare one’s observations with history sometime. Here’s the orbital plot for STT 410AB, first observed by Otto Struve in 1843. The red line and dot are my observation of the double obtained by speckle interferometry on September 9, 2015. The green + signs and the green lines showing the residuals are historic observations going back into the 1800’s, and the blue + signs are more modern observations, some by CCD imaging, others by speckle interferometry. Note that the more recent observations are beginning to deviate from the best fit ellipse that includes the old visual observations. My observation continues the trend.
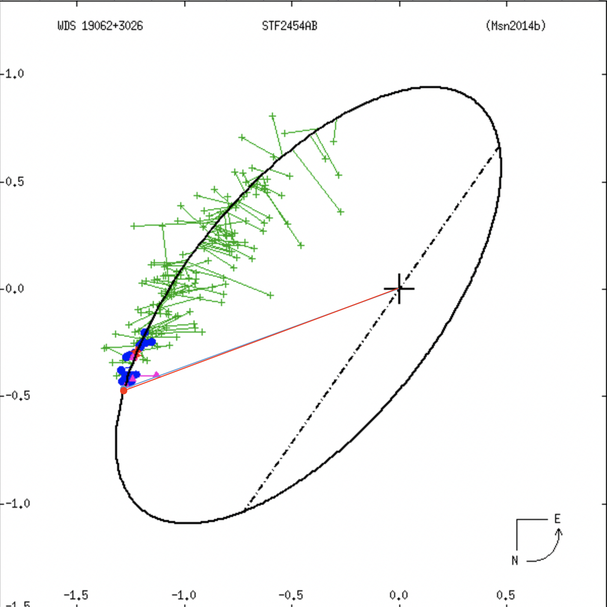
November 3, 2016. Here’s the plot for STF2454AB, first observed by Friedrich Struve in 1831. Old historical observations, mostly visual, are again in green, with more modern observations in blue. I don’t know whose red triangles are on the plot, but they are pretty far off. My single observation on September 7, 2015 by speckle interferometry is the red dot and red line. Note that my single observations are really the average of rho and theta measurements from ten or more speckle interferograms.
Speckle Interferometry
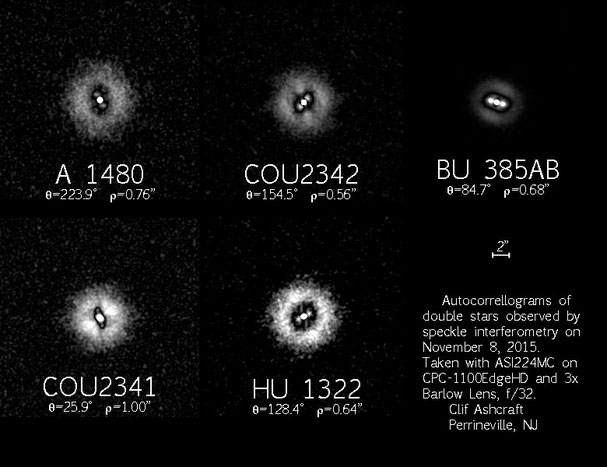
I have begun a program of measuring very close double stars using the technique of speckle interferometry. Below are some examples of autocorrellation diagrams from
sets of 10,000 images taken of the speckle patterns of some close doubles. These images were processed with the program PS3 written by David Rowes. Observations were made with an
ASI224MC camera coupled to my CPC-1100EdgeHD telescope with a 3x Barlow lens giving f/32. The 10,000 images are grouped into ten FITS cubes of 1000 images each before processing. This
gives ten independent measures of theta and rho and allows a measure of the variance of the results.


July 19, 2008. Locating ES 1089 with the aid of the video finder. The telescope was first pointed to the starfield containing ES 1089 using the optical finder on my
telescope, a 9x50 monocular with erecting prism. Pointing anywhere between the 4.8 and 4.9 magnitude stars 52 Her and 43 Her suffices to get the region within the field of view of the video
finder, a DMK21 fitted with a 50 mm C-mount lens. Once that is accomplished, moving the telescope using the hand controller quickly brings the region of ES 1089 under the crosshairs of Al's
Reticule, a freeware overlay and bringing the little star cluster into view of the ST-8.

WDS 16465+4759 ES 1089, the view through the ST-8


STF 2578

STF 2462


HJ 2999
Equipment and Computer Software
My observations were made using an SBIG ST-8 CCD camera coupled by a three element achromatic Barlow lens to my f/6 12.5" Newtonian reflector. The Barlow lens
extends the focal length to 178.44 inches1 to provide a more useful plate scale for the measurements. The camera is equipped with a set of photometric filters mounted in the SBIG 10 position
color wheel and remotely operated by the program CCDOPS (supplied with the camera). The telescope aperture and focal length are entered into the program and are part of the parameter data saved
with each image file. The double star measurements were done using the CCDOPS crosshair tool on the raw image files. The program computes centroids of the star images and measures distances and
angles to subpixel precision. An Excel spreadsheet was used for data logging and for calculating averages and standard deviations. A computer with Windows XT operating system running CCDOPS and
the other programs needed was stationed in a cubicle adjacent to the observing area. Remote focus and telescope slow motion controls were also routed to this cubicle.
Experimental Procedure
I compiled my observation list by selecting stars from a seasonally appropriate range of right ascensions from the Neglected Northern Doubles list and then sorting
the list by date of last observation and the separation of the double. Additional stars were included as observation targets as I happened to encounter them in the sky and in response to postings
on the binary-stars uncensored discussion group.
Rather than relying upon setting circles, I located target objects with the help of the program Guide 8.0 (a desktop planetarium and charting program4), a 9x50
correct image finder on my telescope, and the image on my computer screen from the CCD camera operating in focus mode. This mode provides a nearly "live" image of what the telescope is
pointing at, which is updated every few seconds. The program Guide allows the user to select a circle the same angular diameter
as the field of view of the finder and also provides a rectangle covering the same area of the sky
and with the same field orientation as the CCD camera. The circle and rectangle are plotted to-scale on the star field. When zoomed out to a scale where constellations are visible the program
helps to roughly point the telescope using a zero power projected red dot finder. When zoomed in until the finder circle fills the computer screen it supports close pointing using the 9x50
finder. And finally, when zoomed in until the CCD rectangle nearly fills the screen, it makes the final positioning of the object of interest in the center of the CCD field easy and unambiguous.
The field orientation can be rotated to match either the finder view or the CCD field. In most cases, the field containing the double star could be quickly positioned on the camera CCD by simply
pointing the telescope at a nearby field star and star hopping to the double by watching the "live" image from the camera in Focus Mode and the Guide sky chart next to it on the computer monitor.
In all cases so far encountered there were sufficient field stars around the double to permitan absolute identification of the WDS location of the double by visual pattern matching. Once the
double was located in the CCD image, a series of 12 images was taken, four each through I, R and V photometric filters. In some cases, additional images were taken through other filters.
Exposures were in the 0.5 to 10 second range depending upon the brightness of the stars. Guiding was unnecessary for these short exposures. Since atmospheric seeing affects the star images, I
saved for subsequent measurement
only the images in which the stars were as round and small as possible for the seeing conditions.
When seeing was too bad to obtain decent images, I simply closed up and went to bed. Hand entries describing each observation were made in a dated and signed notebook at the time of
observation.
Image measurement was done the next day using the "crosshair tool" provided in the program CCDOPS. The magnitude of each star and the angle and separation of
each pair were logged into my Excel spreadsheet. It is unfortunate that the angle measured by the crosshair tool in CCDOPS is not actually the position angle. The program measures angles
clockwise from a line pointing to the top of the image on the computer monitor. This is opposite to the convention for position angle, and the orientation of the zero direction is dependent upon
the orientation of the camera relative to the telescope. This must be determined by observation using drift exposures. To do this I position a star near the eastern edge of the field and take a
40 second exposure with the telescope drive
turned off. The star trail on the image is in the east to west direction (position angle 270°). In the camera orientation I normally use, north is to the left and the star trail (indicating the
exact direction of west, θ = 270°) goes from the bottom of the image to the top. I carefully measure the angle this line makes with the vertical (angle d) and use it to convert the angle that
crosshair provides (angle c) to the true position angle:


I calculate the average of all 12 crosshair angle measurements before making this conversion. Similarly, the separation of the components of the double star is the average of all 12 measured separations. This method of obtaining the data compensates for distortion of the field geometry by atmospheric seeing effects and provides measurements that have subpixel scale accuracy. Since my telescope tracking is not perfect (periodic error, wind effects), it is similar in this respect to the technique of dithering used to advantage in under-sampled CCD images.
The magnitude differences, Δm = mB-mA, were calculated for each image and averaged over the four values obtained for each filter. The standard deviations of each Δm
value were also calculated.
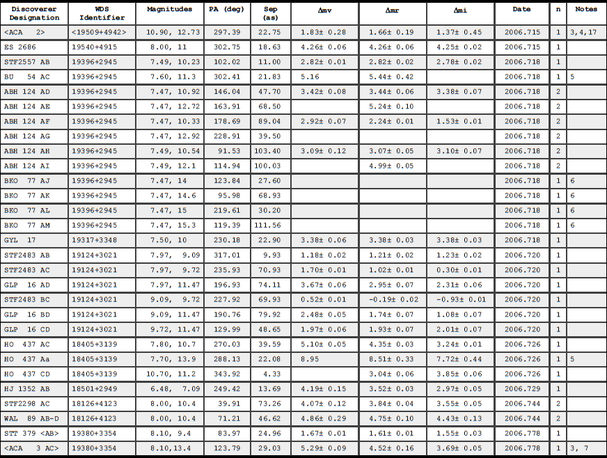
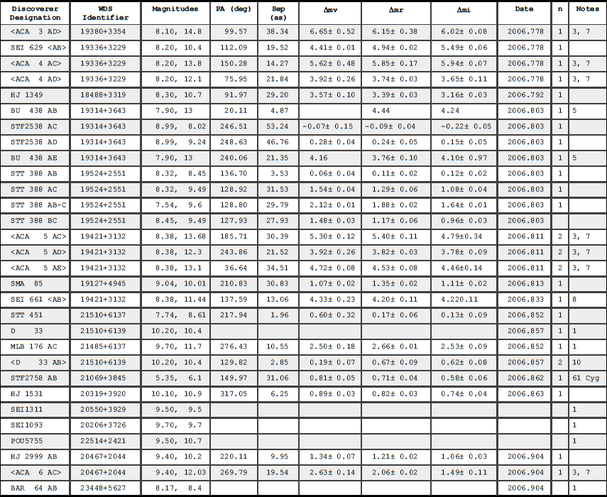
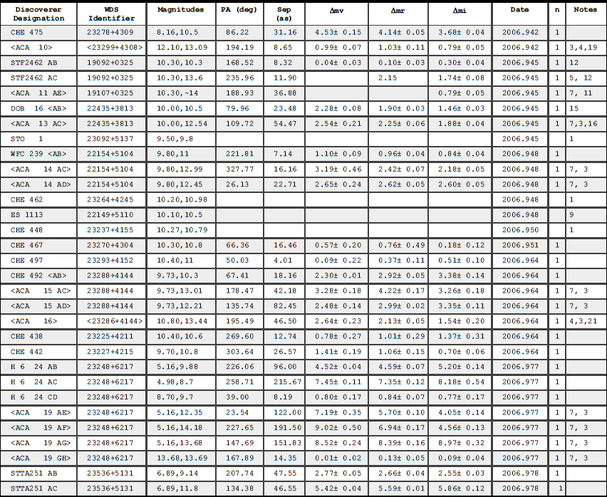
The table below is a record of all my observations from the middle of August 2006 until the end of the year. The first column gives the discoverer designation and
the second column the WDS identification number. The latter is a shorthand representation for the approximate right ascension and declination of the double star in hhmm.m±ddmm format with the
decimal point omitted. Note that the items enclosed in < > signs are my provisional designations, not those of the
WDS. The third column is in most cases the WDS magnitudes of the objects. In the case of new components (or new double star systems) the magnitudes are calculated from the magnitude of component
A already in the WDS by adding the measured value of ΔmV, or by taking the magnitudes from the GSC (Guide Star Catalog) as provided by Guide. The fourth column is my measurement of the position
angle in degrees. This is usually the average from twelve images taken through three filters (V, R and I, four images through each filter). In some cases, more
or less images were used. These cases are noted. Similarly, the fifth column is the separation of the components in seconds of arc, also usually the average of the measurements from twelve
images. The sixth, seventh and eighth columns contain the Δm values and their standard deviations through the V, R and I photometric filters. Each value is usually the average of four
measurements. In a few cases (faint red companion stars), the star was not visible in the images taken through the V filter so no ΔmV is provided. In cases where no standard deviation is
supplied, the star was visible on only one image. The ninth column is the date (year plus decimal fractional year), and the
tenth column is the number of nights the object was observed. Note that even when n=1, the data provided are averages over a substantial number of images, usually 12. Finally, the eleventh column
refers to the notes in table 2. Some of the entries in the Table 1 contain no new
data from my observation. These entries represent neglected doubles that are probably truly lost. In these cases there is nothing present in the field implied by the WDS identifier (or the
precise coordinates, when available) that could possibly be the object described by the discoverer. In two cases (WRH23 and D 33) I was able to find the object in a nearby field, but in most
cases this was not possible.


Notes to Table
1. No star matching description found at WDS position
2. Same system as WDS 19448+2916 ISM 4. Exact coordinates: 19 44 48.7 +29 15 53
3. Magnitude of secondary calculated from magnitude of primary and ΔmV
4. New double star not presently in WDS
5. Only one image of the four taken through this filter showed this component, no standard deviation possible
6. "Sky Glow" anti-light pollution filter used for these faint companions, Δm values not meaningful
7. New component for a multiple star system already in the WDS
8. Magnitude of secondary questionable, probably fainter than listed in WDS
9. Stars not resolved
10. Position implied by WDS identifier for D 33 is incorrect. D 33 is identical with MLB 176 AB.
Exact coordinates: 21 48 29.9 +61 36 54
11. Magnitude estimated, image very faint through V filter
12. WDS position for STF2462 is incorrect. RA is 19h10.7m
13. Δm using B filter was 4.74
14. Δm using B filter was 4.38
15. Δm using B filter was 3.02 ± 0.16
16. Δm using B filter was 2.66 ± 0.18
17. Star A is GSC 3565 1231, magnitude 7.259
18. Star A is GSC 2736 1376, magnitude 9.424
19. Star A is GSC 3242 496, magnitude 12.1
20. Star A is GSC 3642 348, magnitude 9.658
21. Star A is GSC 3238 944, magnitude 10.8
22. Star A is GSC 3651 586, magnitude 11.9
23. Star A is GSC 3651 486, magnitude 9.525
24. Star A is GSC 2763 2479, magnitude 14.4
25. Star closest to WDS position is 7th magnitude TYC 3623 850 which is also identified with HJ1853 by Guide. Star is either not a double or is unresolved in my system. No 7.7 mag companion
present

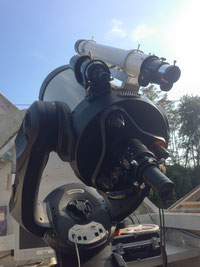

The C14 retired from Jenny Jump


Mars Sept 8, 2020